
Improved versions of NDVI, these metrics broaden the analytical perspectives of forests, agricultural areas and animal production systems
Among the remote sensing algorithms that assess the health and development of vegetation cover through electromagnetic radiation - i.e. by calculating the reflectance of sunlight by plants - the Normalized Difference Vegetation Index (NDVI) is the most common. Normalized Difference Vegetation Index) was, for a long time, the best known and most widely used indicator.
However, due to some limitations that will be better understood below, more advanced spectral indices have emerged to make diagnoses of natural ecosystems and plant and animal production systems even more accurate.
As the Enhanced Vegetation Index (EVI - Enhanced Vegetation Index) and the Enhanced Vegetation Index-2 (EVI2 - Two-band Enhanced Vegetation Index), indicators widely used in precision agriculture and forest monitoring.
What is EVI and how does it differ from NDVI?
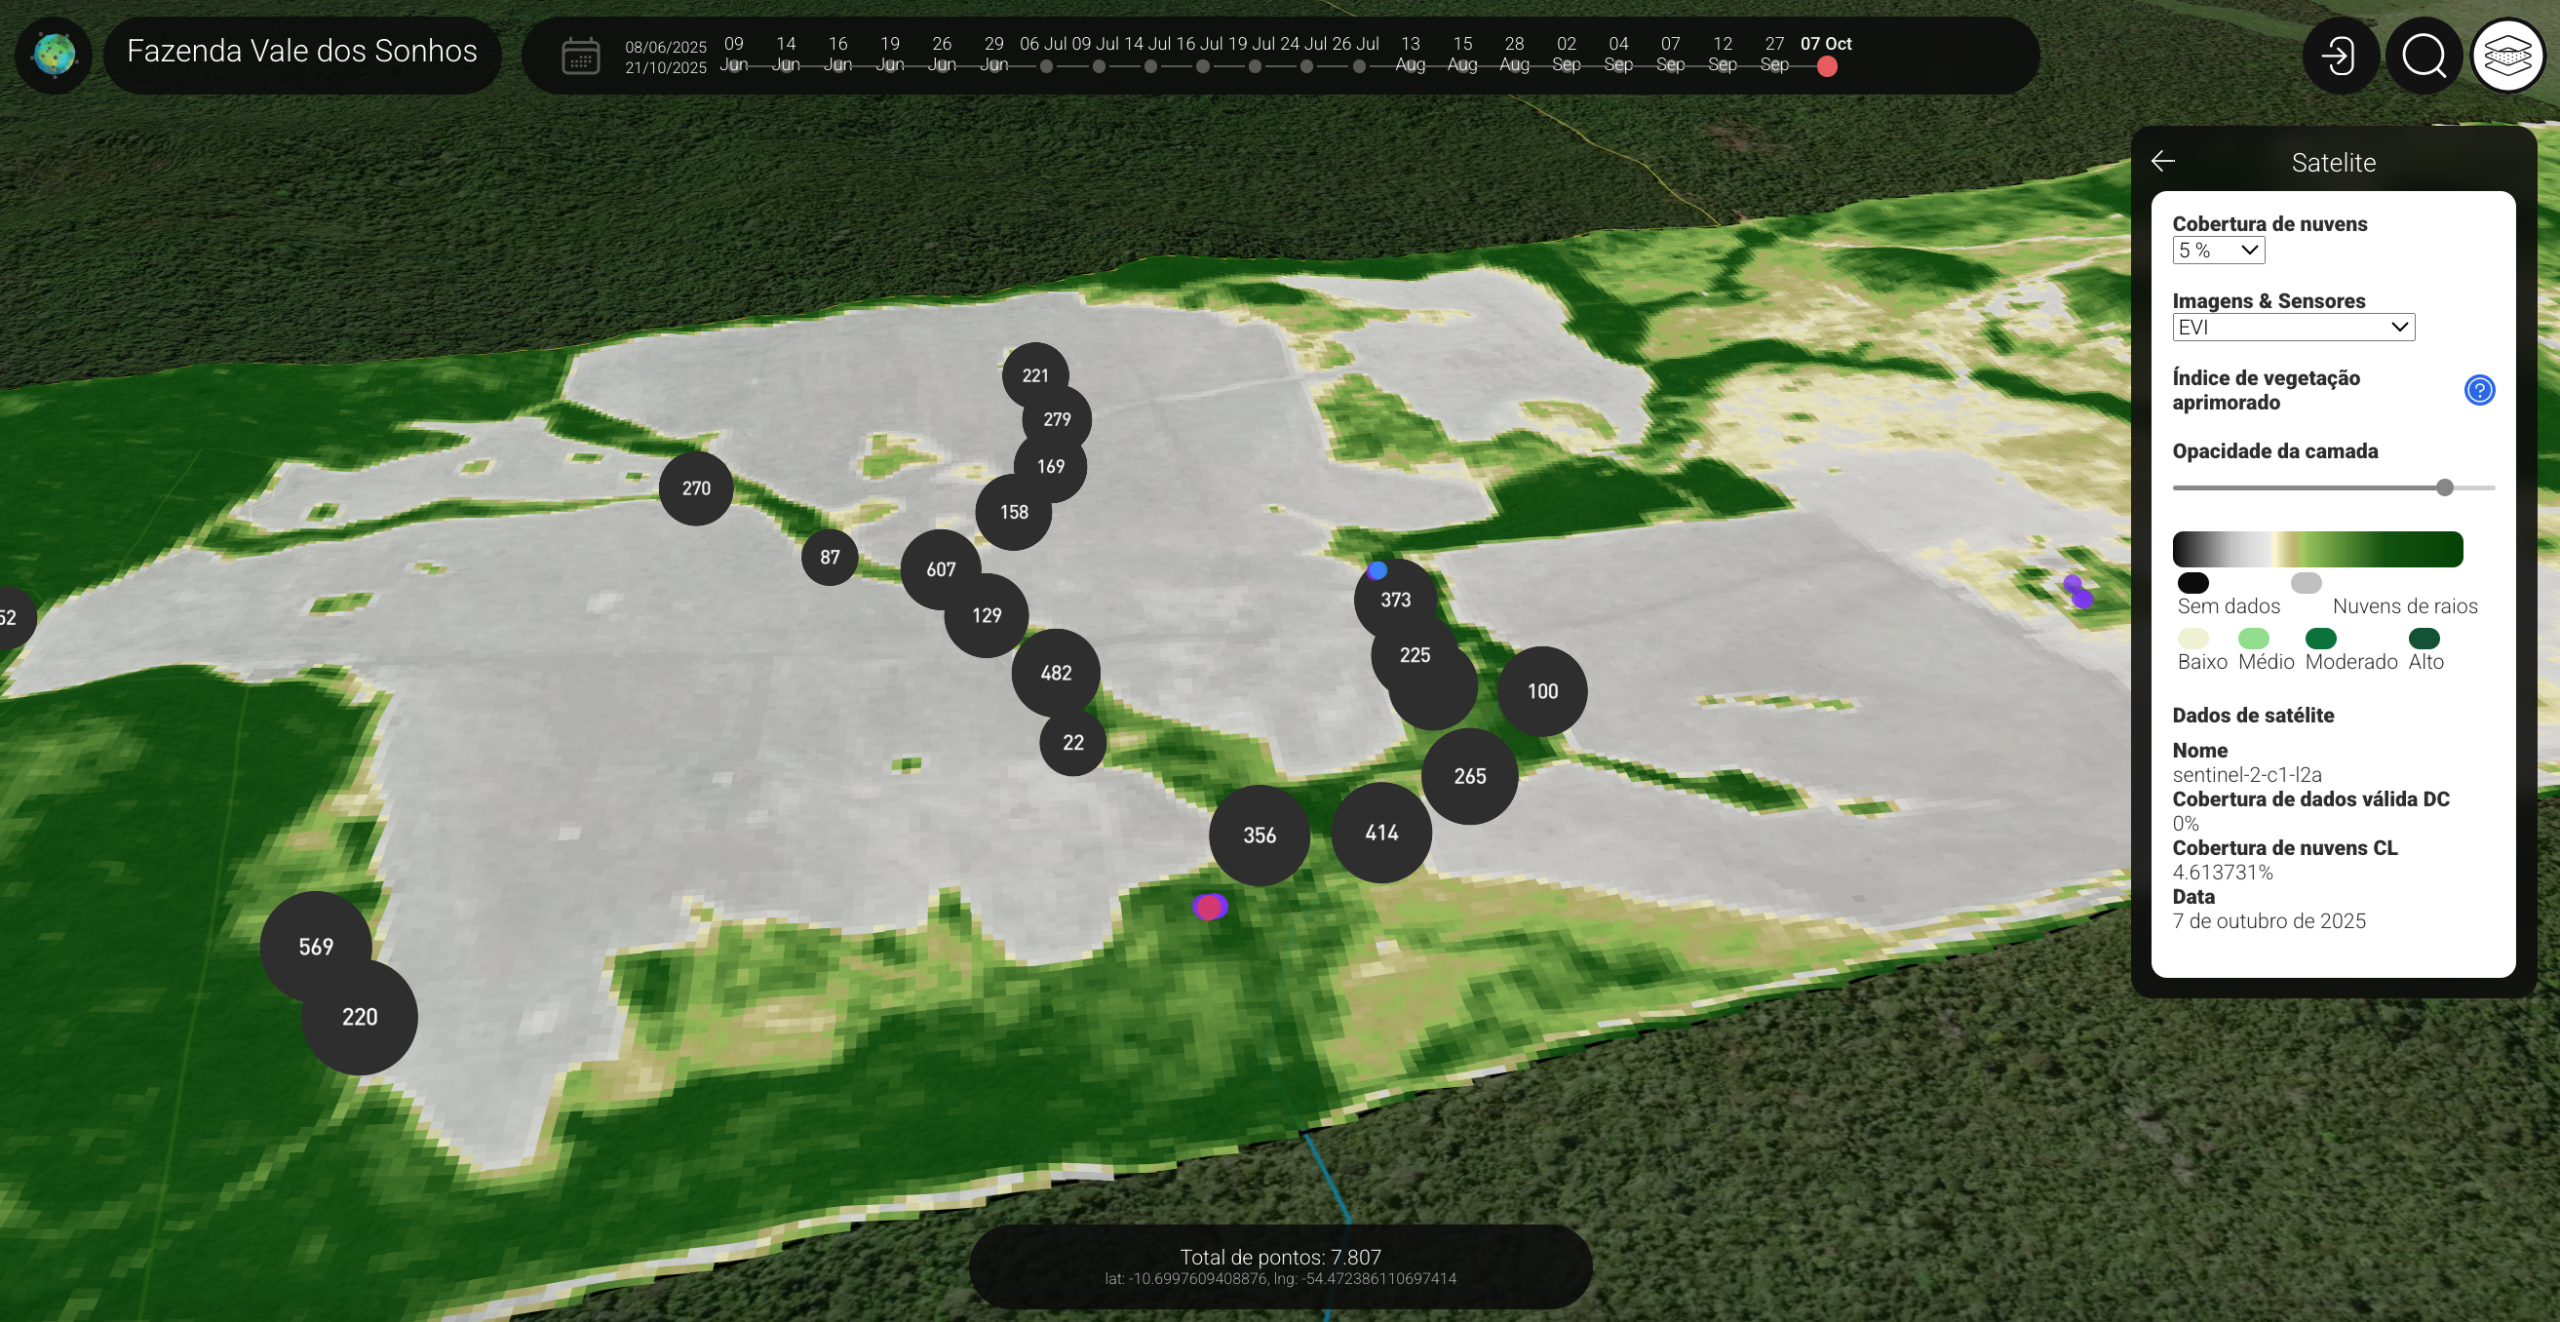
Using the range of values from -1 to +1 to quantify the greenness and vigor of plants - with results between 0.2 and 0.8 indicating healthy vegetation - EVI is calculated using the formula EVI = 2.5 * ((NIR - RED) / ((NIR) + (C1 * RED) - (C2 * BLUE) + (L)).
Considered an optimized version of NDVI, This metric was developed to be more sensitive to the presence of chlorophyll and to mitigate atmospheric and soil distortions that affect this index. The main difference between the two is that EVI handles additional information from different spectral bands:
- EVI: in addition to considering the red (RED) and near infrared (NIR) bands, as NDVI does, it also uses the blue (BLUE) band to adjust for the influence of soil and canopy noise. And it includes coefficients (C1, C2 and L) that can be altered according to regional conditions, in order to reduce the effect of aerosols in the atmosphere (such as dust and smoke) that end up distorting the readings of the RED and NIR bands.
- NDVI: using the spectral response of plants in the red (RED) and near infrared (NIR) bands, works by comparing the light that the plant reflects in the NIR, which is a strong indicator of biomass and vigor, with the light in the RED band, which is absorbed by chlorophyll for photosynthesis.
Between these two indices, what determines the choice?
The answer is simple: while EVI is ideal for monitoring dense forests and early (low cover) and late (high biomass) crop stages, the “simpler” NDVI is suitable for analyzing areas with sparse vegetation.
In other words, in places with high biomass - such as tropical regions like the Amazon and advanced corn and sugar cane plantations - where NDVI can be exposed to noise and saturate, i.e. reach its maximum value, EVI becomes a more accurate indicator for measuring vegetation variations.
Likewise, this index is recommended for time series analyses involving several consecutive dates, and is more effective for monitoring annual dynamics and seasonal changes in green areas, such as the increase in vegetation during the dry season.
EVI2: a simplified but powerful alternative
Although EVI is a fairly solid metric, its application depends on the availability of certain spectral bands that are not always present in all satellite sensors.
To overcome this restriction, researchers have developed EVI2, a simplified version of EVI that is capable of examining vegetation conditions using sensors that do not have the blue band. This is the case with older satellite devices and even advanced very high resolution radiometers (AVHRR).
Similar to EVI, this index uses two sensor bands instead of three: RED and NIR, just like NDVI. However, it maintains a high correlation with the results obtained by the original EVI - which guarantees greater flexibility and variety of applications at regional and global scales.
The importance of using indices in combination
Considering that each vegetation index has its advantages and limitations, the choice of the most appropriate technology depends on the purpose of the study, the availability of data and satellite images and the characteristics of the ecosystem being analyzed.
In many cases, the NDVI, EVI and EVI2 are conveniently used in a complementary way, so that insights much more robust information on all the evolutionary stages of vegetation can be extracted.
In order to support highly assertive and sustainable preservation and management strategies, the Forest Watch closely monitors the improvement and application of these indicators, reinforcing its commitment to intelligent vegetation monitoring and the dissemination of technical knowledge to the environmental, forestry and agro sectors.
Leave a Reply