
Capable of minimizing “soil noise”, the tool is ideal for precise analysis of initial plant growth and arid regions
It is used for various purposes, including calculating leaf area index and aerial biomass. Normalized Difference Vegetation Index (NDVI, the acronym for Normalized Difference Vegetation Index) is the most common remote sensing resource used to characterize and monitor vegetated areas.
However, an extremely powerful indicator is gaining more and more ground in the agricultural and environmental scenarios. Especially when the main focus is on monitoring the vigor and productivity of crops and planted forests in certain contexts, such as areas with low vegetation cover.
We're talking about the Soil Adjusted Vegetation Index (SAVI). Soil Adjusted Vegetation Index), a numerical indicator developed to overcome the limitations of NDVI due to the so-called “soil effect”.
Soil adjustment factor differentiates the index
Considered an improved version of NDVI, SAVI is an especially useful metric for estimating the quantity and health of vegetation in places where exposed soil can interfere with measurements. For example, in arid or semi-arid regions and in the early stages of cultivation, when the vegetation concentration is still partial (below 15% of the total area).
In these scenarios with low leaf cover, the data obtained via satellite ends up reflecting both the crop and the soil, which can compromise the values of other indices and make it difficult to correctly interpret the information generated.
In order to improve the NDVI values and correct for the influences of luminosity and soil variability, so as to distinguish soil areas from green areas, SAVI had a correction factor added to its calculation process that takes the canopy substrate into account: the L constant, which can have values ranging from 0 to 1 depending on the density of the vegetation.
Detailed SAVI formula
Represented by the equation SAVI = ((NIR - RED) / (NIR + RED + L)) x (1 + L), where NIR is the reflectance of the near infrared band, RED is the reflectance of the red band and L is a constant that adjusts for the influence of the soil, considered to be ideal reference values for L:
- L = 1: for areas of sparse vegetation, when the low density allows you to make visual contact with the terrain or see open areas, L should be close to 1;
- L = 0,50: a middle ground is applied for areas with a medium density of vegetation;
- L = 0,25: L should approach 0 in denser areas where, by the way, NDVI is already effective.
Because it encompasses a wider range of vegetation conditions, the L = 0.50 factor is the most widely used. However, it is important to understand that SAVI is restricted to different biomes and agricultural conditions, since the values of the constant are generalized and only take into account vegetation density - and not the specific characteristics of the environments analyzed.
Indicator values on visualization maps
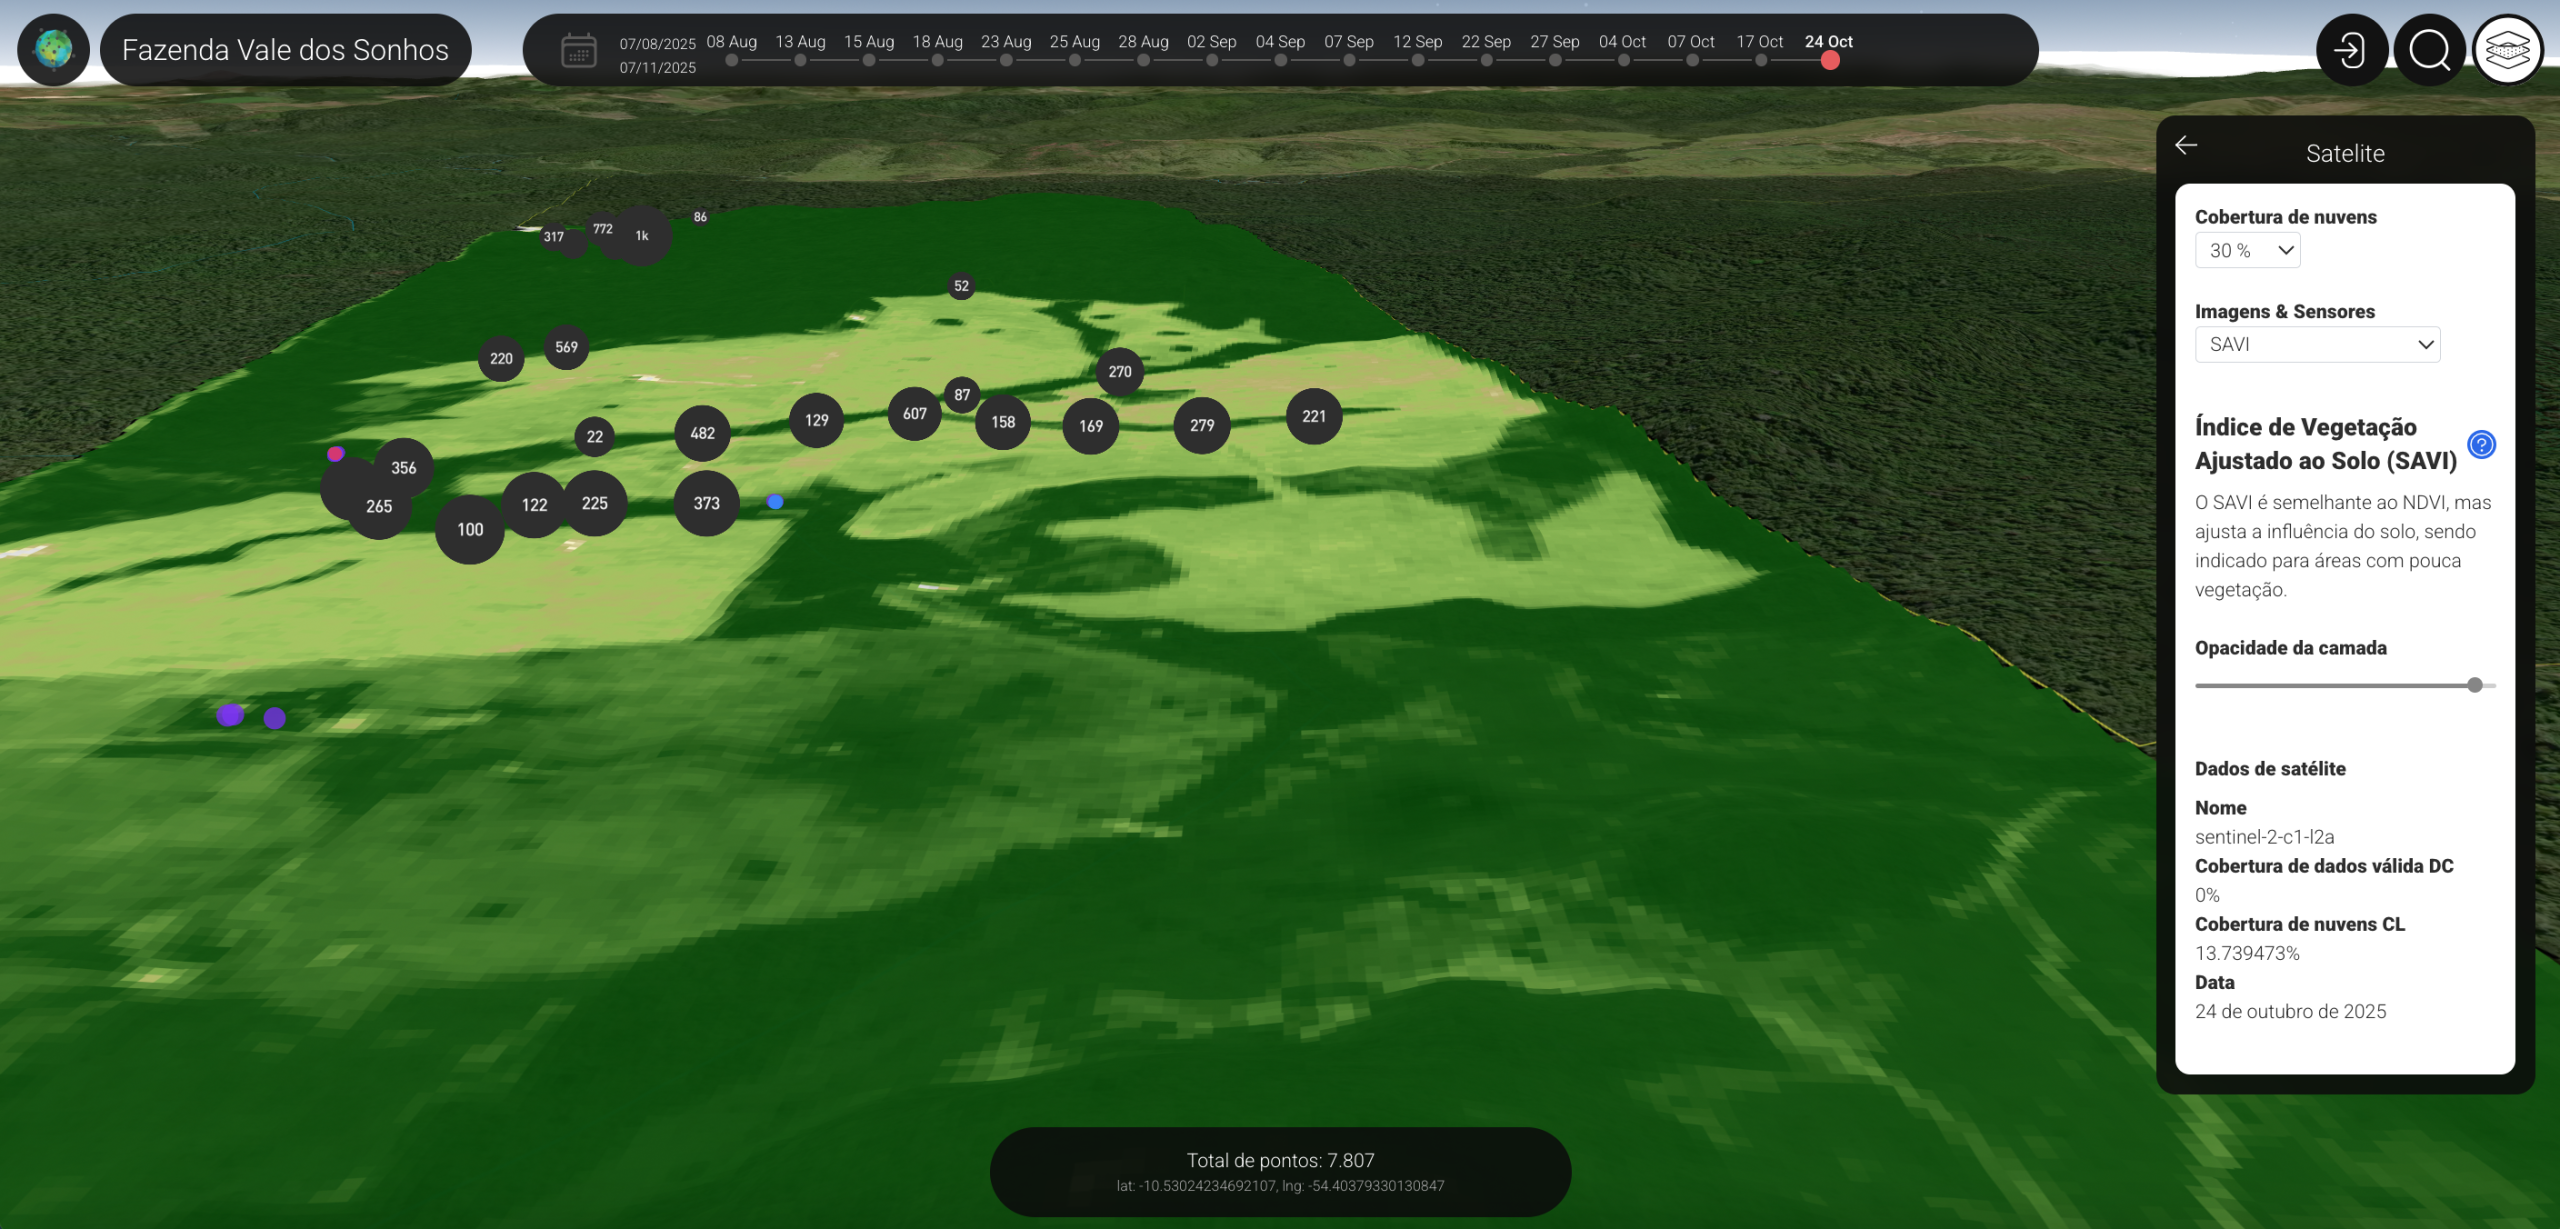
As for graphical representation, the SAVI index generates continuous values between -1 and +1 that can be visualized on maps that use a standard color scale to illustrate the condensation and vigor of the vegetation.
In pre-planting analysis and weed detection, for example, it is common for shades of brown and green to predominate on the maps, marked according to the degree of development of the vegetation cover. This helps to recognize areas that need special attention, optimizing actions in the field.
Although the color scheme varies depending on the platform used, the following logic is generally adopted for agricultural crops:
- Low values (close to -1 to 0.1): brown, beige, red or orange to indicate exposed soil, such as areas without vegetation or with very sparse, dormant or diseased vegetation. Negative values can also indicate bodies of water or artificial structures;
- Moderate values (close to 0.1 to 0.3): yellow or light green to represent vegetation with low to moderate thickness, such as early stages of crop growth or weedy areas;
- High values (close to 0.3 to 1): dark green or, in some cases, shades of blue/violet, to designate dense and vigorous vegetation with high biomass, and to indicate healthy plantings and good soil cover.
Benefits of SAVI with the Forest Watch platform
By providing readings that focus exclusively on plant activity, minimizing distortions in the results obtained, SAVI is positioned as a valuable resource:
- Enhanced differentiation between healthy vegetation and thin ground cover;
- More precise measurements the vitality and density of vegetation in places with a high percentage of exposed soil;
- Accurate monitoring in the early stages of the production cycle, when there is an excess of bare soil between the rows;
- Speed up measurement activities in the field, eliminating the need for analysis for each area studied;
- Efficient identification of weed presence and refined planning of variable or sectorized application of herbicides and other inputs;
- Controlling water stress or nutrition in young vegetation;
- Effective management land and crops, including emergencies, etc.
While other indicators offer more consistent results as plants enter advanced stages of growth, this technology is certainly the most effective when it comes to areas with low chlorophyll content, such as young crops and arid/semi-arid regions.
In Forest Watch, As part of our team, we keep a close eye on these solutions that turn data into strategic decisions. And we work constantly to offer the market the best in innovation, with the aim of boosting productivity and sustainability in the field.
If you want to improve your agricultural monitoring, get to know our solutions, such as SAVI, and find out how we can help boost your results.
Leave a Reply