
By being able to measure the health and vigor of plants, the technology allows for planned and much more profitable crops
Derived from remote sensing (satellite) data, the Normalized Difference Vegetation Index (NDVI) is the most common type of vegetation index. Normalized Difference Vegetation Index) is the most widely used indicator for monitoring vegetated surfaces, especially agricultural areas.
A powerful resource for assessing plant health, it allows farmers and environmental managers to follow the development of the total crop cycle - which effectively helps to identify problems at the right time and, consequently, to make assertive management decisions.
An excellent technology for supporting precision agriculture, NDVI takes into account the way plants reflect light (usually sunlight) at specific frequencies to measure their vitality. In other words, using sensors that capture two bands of the electromagnetic spectrum (NIR and RED), the degree of reflectivity is measured and the index value is generated.
This calculation is represented by the formula NDVI = (NIR-RED) / (NIR+RED), where NIR corresponds to the amount of near-infrared light reflected by the plant's cell structure, and RED is the amount of visible red light reflected by the surface.
Interpreting the NDVI formula
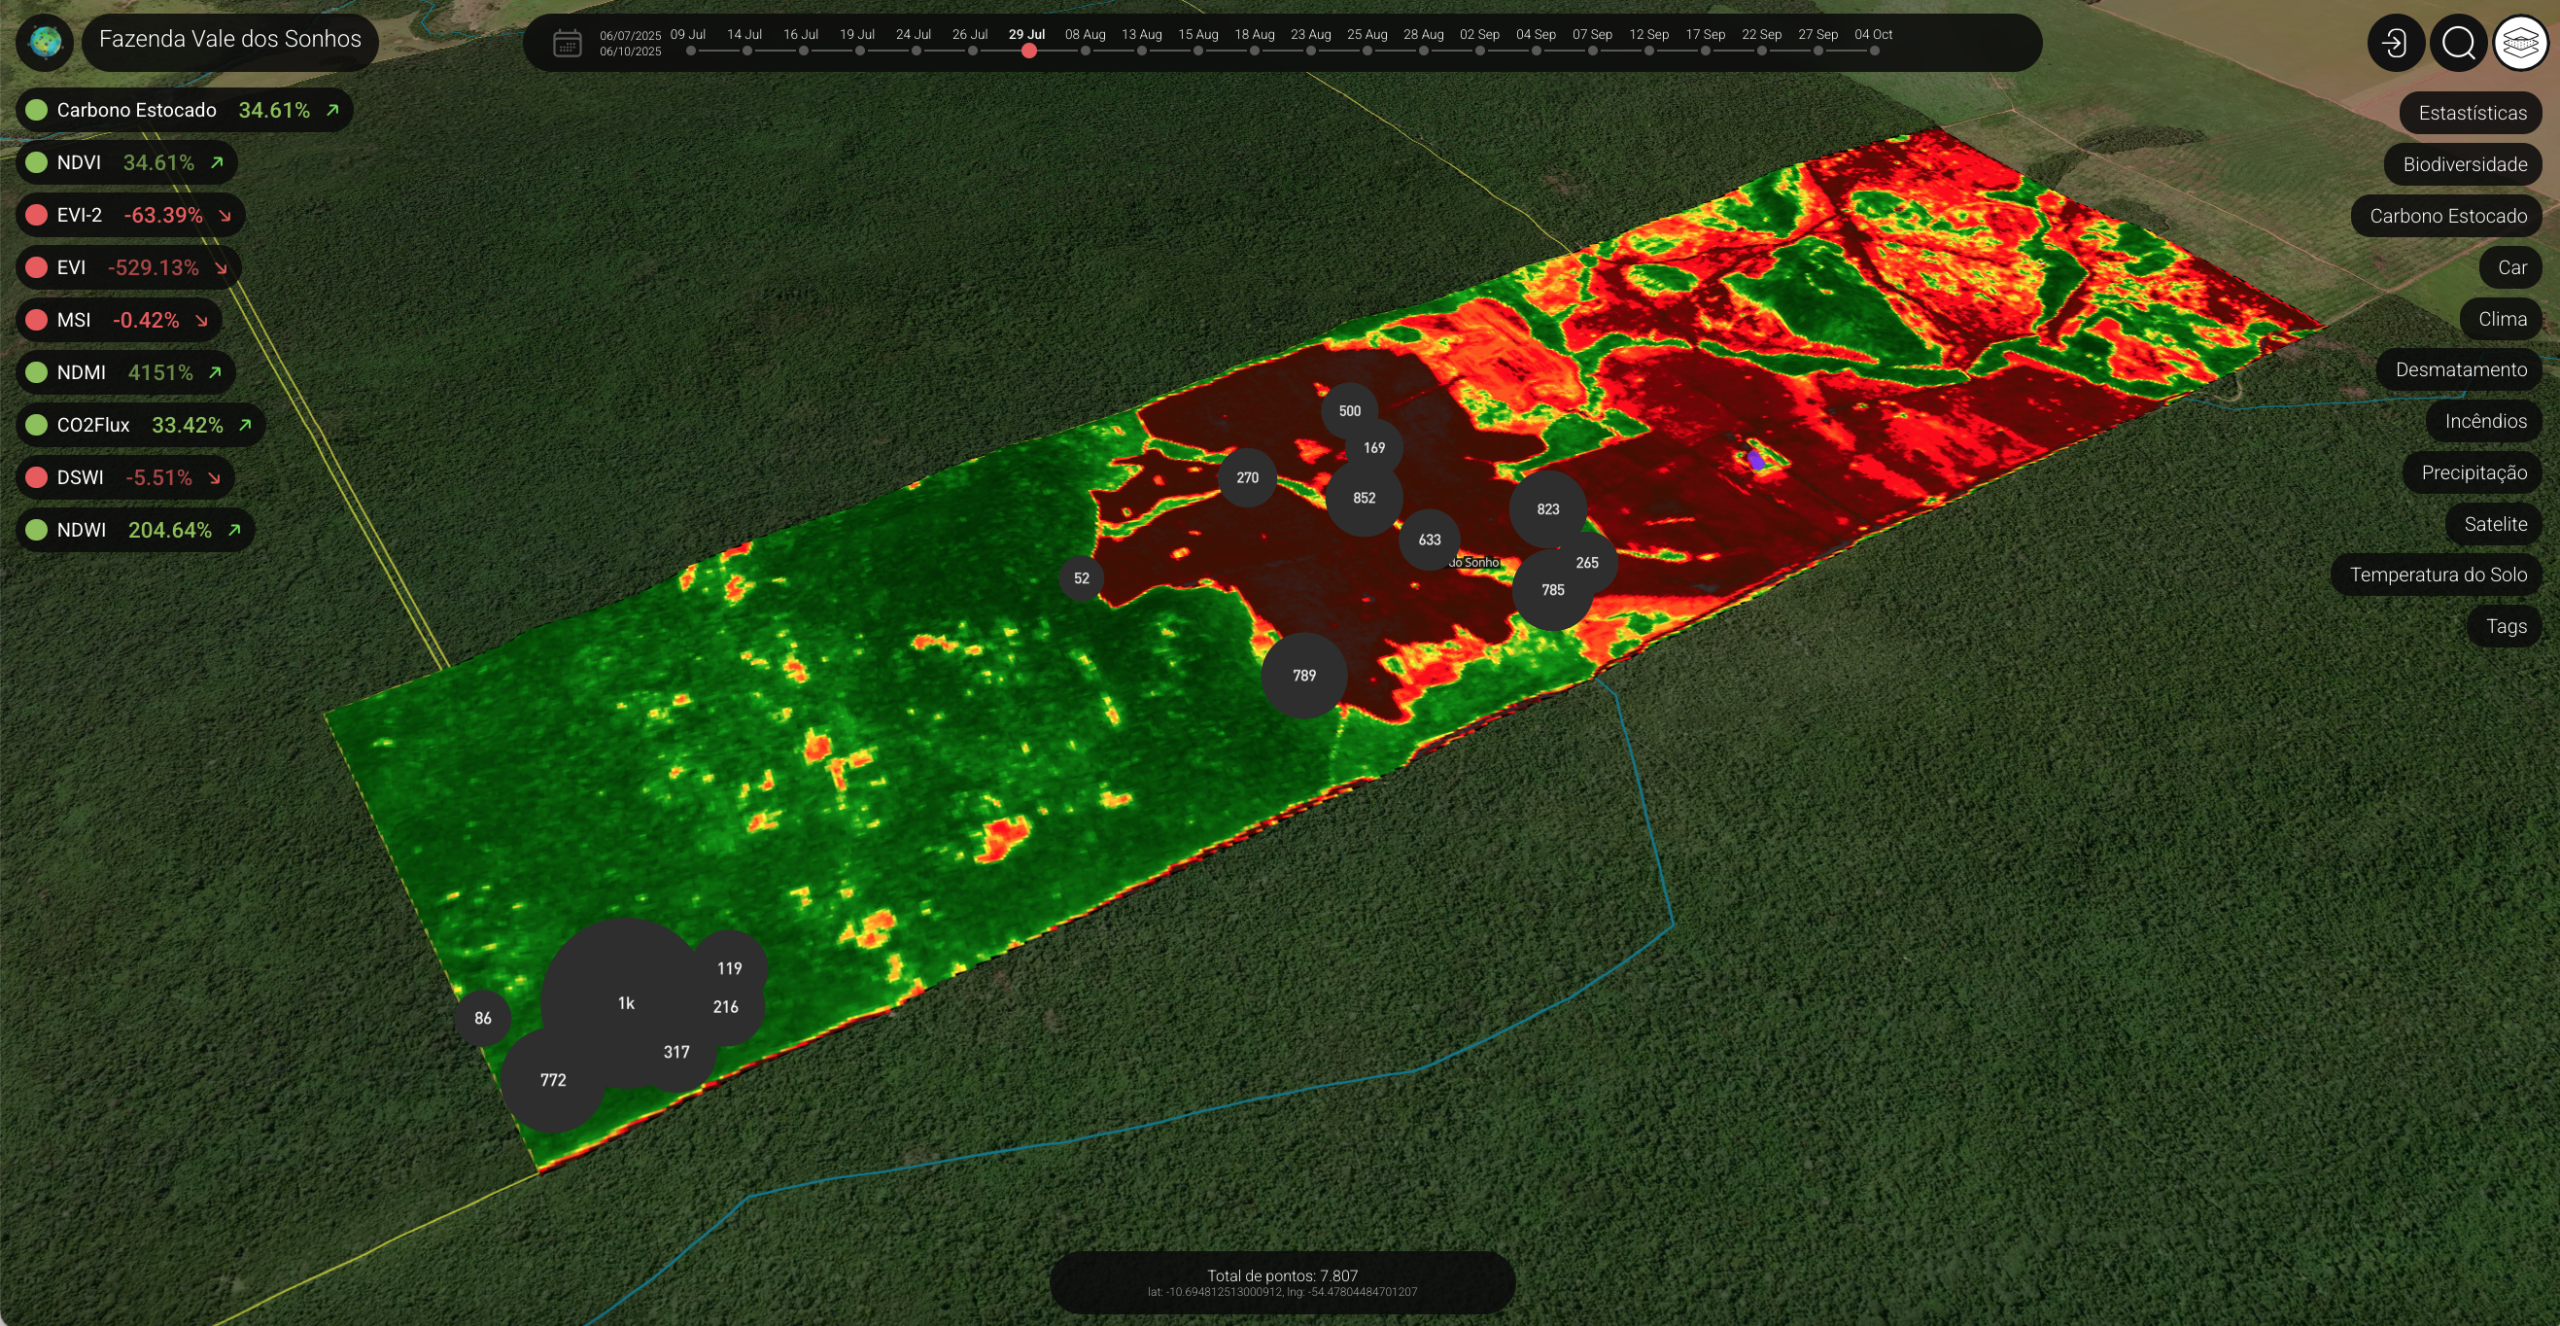
According to Brazilian Agricultural Research Corporation (Embrapa)This equation derives values that are routinely interpreted using the NDVI scale at canopy level - from the leaf and branch cover of the plants at the top of the crop. They vary between -1 and +1, meaning:
- -1 to 0 (negative values): surfaces without vegetation or with very low photosynthetic activity, formed by dead plants or non-vegetated targets such as stones, water, snow, exposed soils, sandy or built-up areas;
- 0 to 0.33 (low values): surfaces with no or little photosynthetic activity, with very sparse vegetation or subjected to stress, such as dry fields;
- 0.33 to 0.66 (moderate values): surfaces with moderately healthy or developing plants, such as pastures and green roofs entering dormancy;
- 0.66 to 1 (high values): surfaces with dense and very healthy vegetation, such as vigorous plantations, mature forests and swamps.
It is on the basis of these ranges of values, generally represented by the colors "red-green", that the NDVI indices are presented on maps:
- -1 a 0: red;
- 0 a 0,33: orange to yellow;
- 0,33 a 0,66: variations of green;
- 0,66 a 1: vibrant green.
It's important to note, however, that these figures are general notions that can vary, as they don't take into account NDVI fluctuations at canopy level during the development stages. This makes it essential to consider the type of crop, soil, atmospheric and climatic conditions and season, among other peculiarities, in order to better understand the results.
And how does light indicate plant health?
We have seen that NDVI is measured by the contrast between near-infrared light reflection (NIR) and red light absorption (RED), two phenomena that result from the presence and activity of chlorophyll in a plant - or the lack of this green pigment that is essential for photosynthesis.
This is possible because while healthy plants rich in chlorophyll absorb a lot of RED and reflect a lot of NIR, areas without vegetation or under stress and deficient in chlorophyll reflect less NIR and absorb more of this light.
In other words, by revealing how much light they absorb and reflect, you can understand whether there is progress or a reduction in green spaces, based on how healthy the plants are.
Benefits of the NDVI offered by Forest Watch
With data extracted from high temporal resolution satellites that capture multispectral information and images with a high level of detail, the Forest Watch offers the best in agricultural monitoring via NDVI.
And the best part: as well as automatically calculating the NDVI values, the platform does all the work of cross-referencing the processed data and converts it into metrics and insights essential for the success and sustainability of production.
The list of applications and main advantages offered by the NDVI offered by our powerful solution include:
- Constant control: continuous monitoring (near real time) to monitor vegetation density and estimate and evaluate active biomass;
- Chronological comparison: monitoring the evolution of the crop to check its development over time, which can be seen on an interactive 3D map that displays historical data in a time series;
- Early diagnosis: early detection of areas with nutritional deficits, water problems, the presence of pests and diseases or other factors affecting crops;
- Efficiency of corrective actions: quick and targeted interventions such as precise irrigation of areas and pest control, avoiding losses;
- Productivity estimates: evaluation of vegetative vigor and crop biomass for analysis of harvest potential, crop forecasting and commercial plans;
- Optimized input management: customized application of fertilizers and pesticides, reducing costs and environmental impacts;
- Intelligent processes: planning activities and making assertive decisions about management practices according to the characteristics of each area, which enables greater efficiency in the use of resources and better crop yields without the need for frequent visits to the field.
Talk to our team to understand how we transform technology into results for the present and the future, helping companies and producers to see beyond what is visible in order to achieve more productive and profitable crops.
Leave a Reply