
In addition to detecting and monitoring water bodies, the index obtained by remote sensing reveals the water status of vegetation
With the intensification of climatic events and the imminent risk of global water shortages, guaranteeing the quality and availability of this natural resource is no longer just a matter of ecological awareness. It has become an indispensable circumstance for the survival of all forms of life - people, animals and plants.
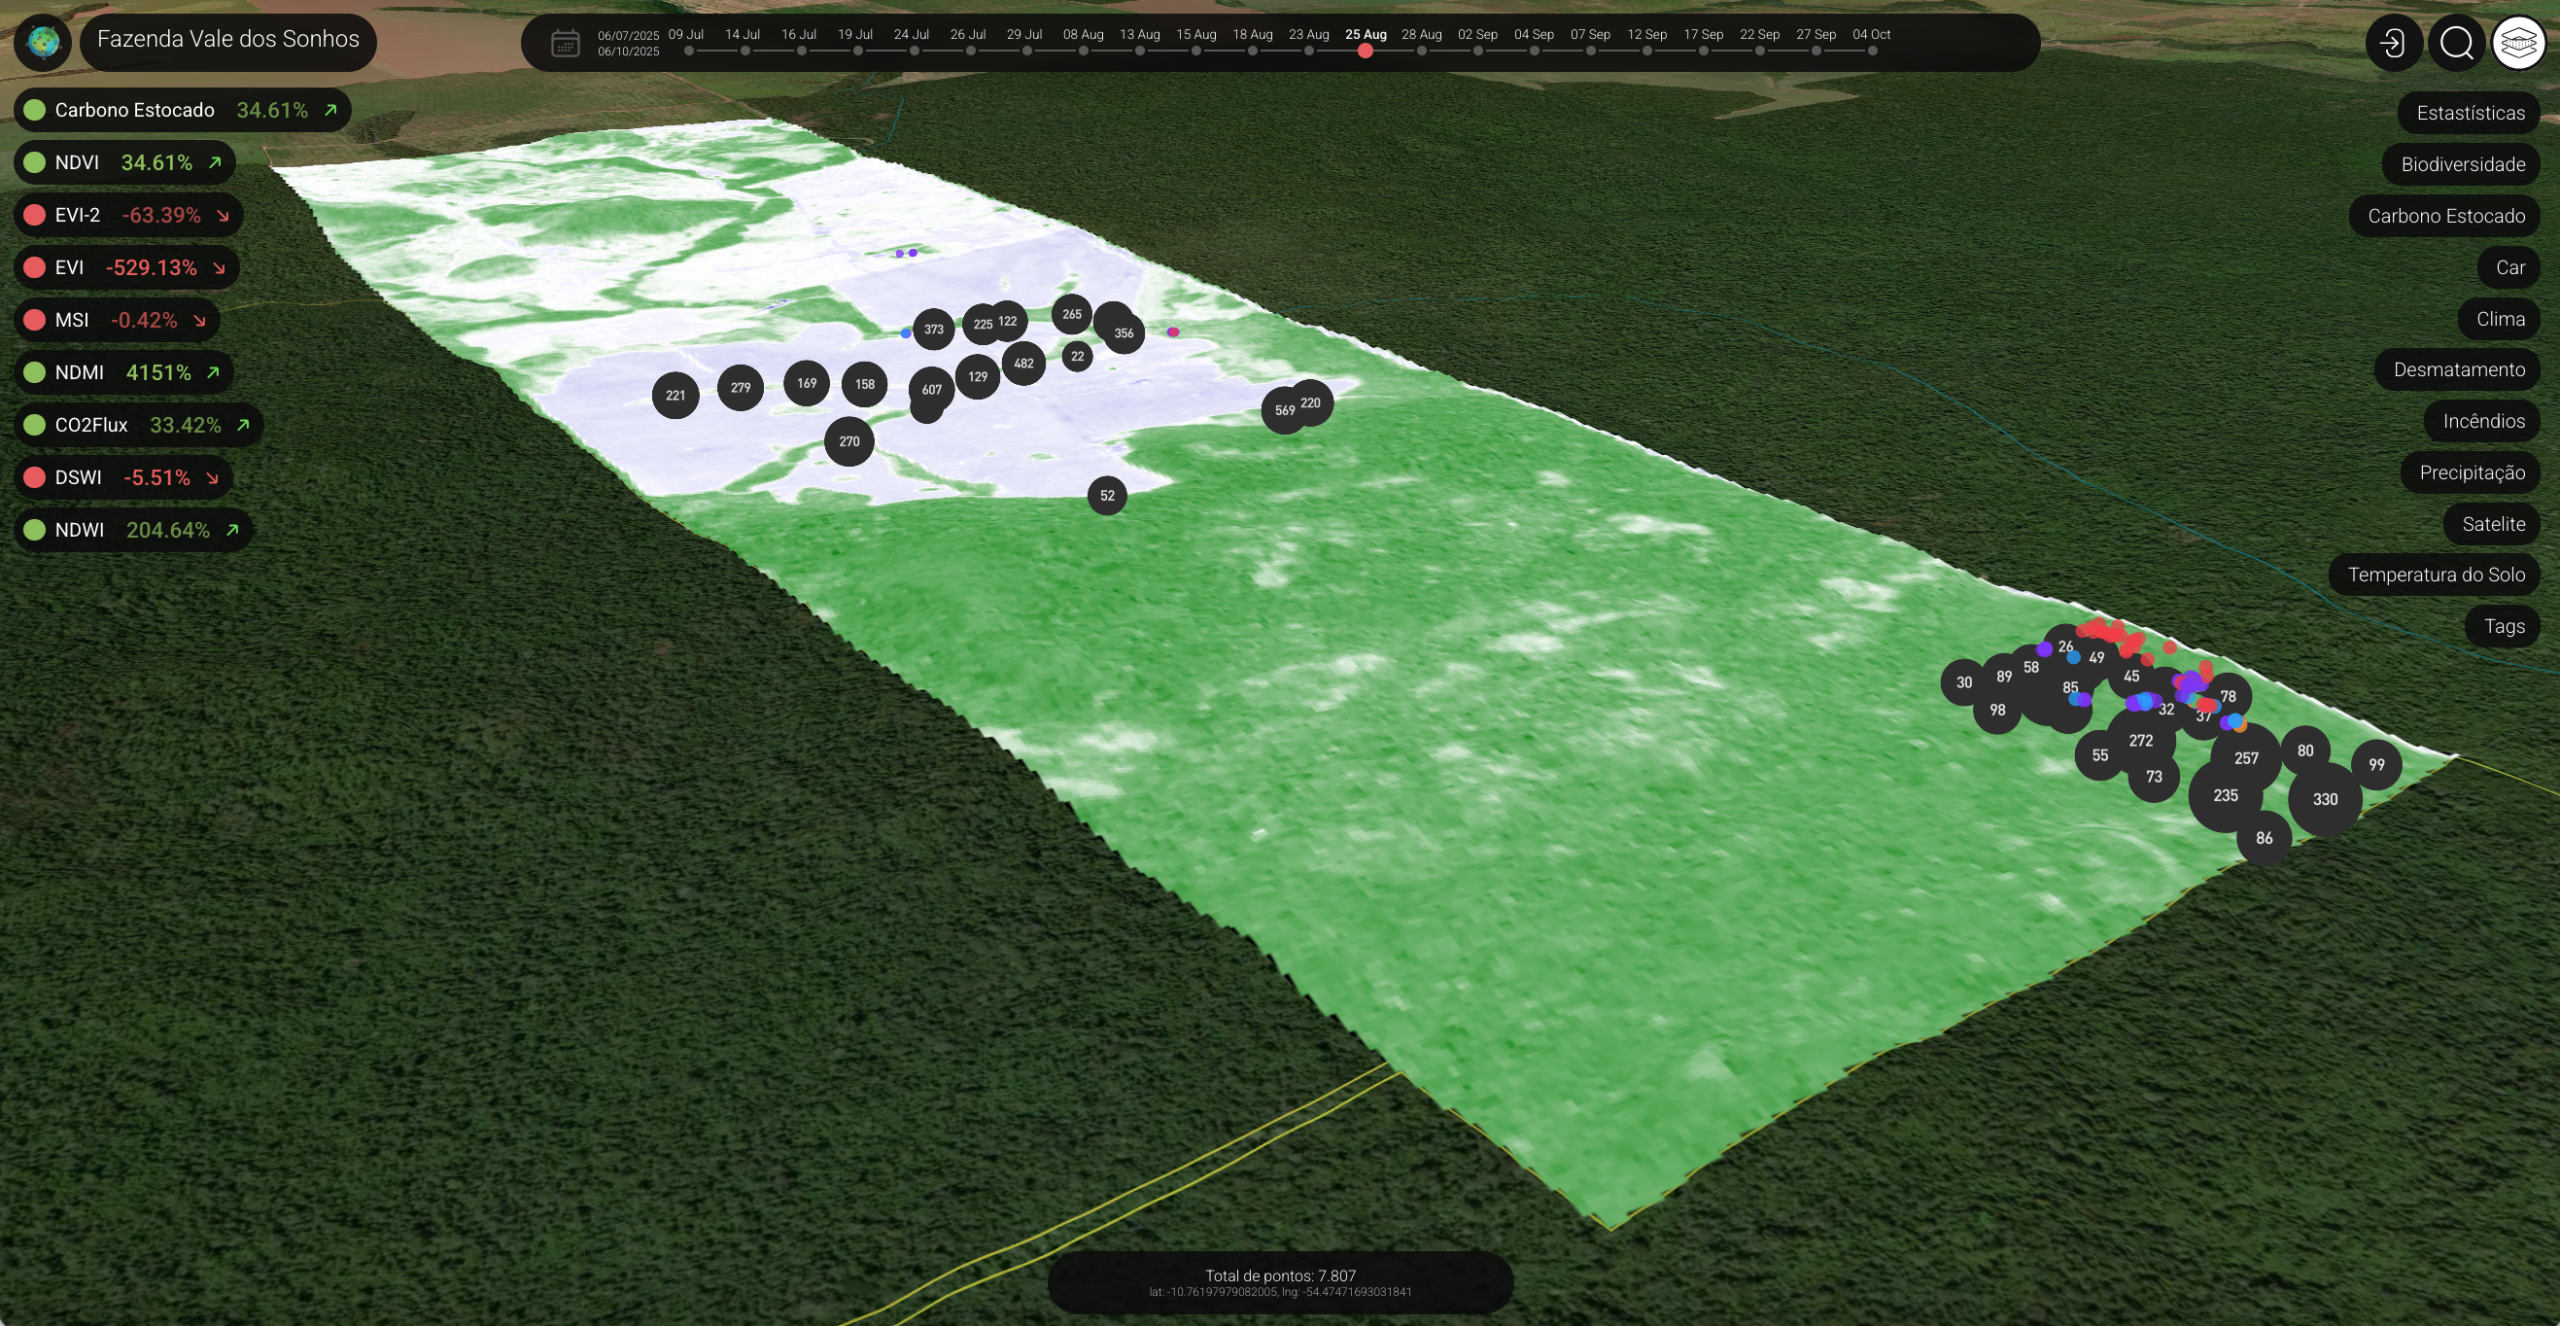
It is in this context that a particularly useful tool for agricultural and forestry productivity stands out: the Normalized Difference Water Index (NDWI), a graphic indicator obtained from satellite images to detect bodies of water and monitor the water status of vegetation covers.
What is the NDWI and why is it important?
Acronym for Normalized Difference Water Index, The NDWI uses two bands of the electromagnetic spectrum - the green (GREEN) and near infrared (NIR) bands - to calculate the reflectance of water and thus distinguish this vital liquid from other elements such as soil and vegetation.
Represented by the formula NDWI = (Green Band - NIR Band) / (Green Band + NIR Band), this indicator can identify the presence of any type of significant accumulation of water. From wetlands to groundwater, rivers to oceans, no water feature is left out. Be it natural or artificial, surface or underground, or even classified as fresh, salty or brackish.
It is also known for its ability to monitor changes in the shape and content (quantity) of water bodies and even to locate areas with deficit or excess moisture, also has a strong relationship with the water content of plants, and is an excellent indicator of the water status of green areas.
Fundamental, therefore, in monitoring plantations and forests, the NDWI guides better management decisions and practices. Especially when used in conjunction with other indices such as SMI and NDVI - which respectively focus on the percentage of water in the soil and the general health and biomass of vegetation.
And how does the index see water from space?
Bearing in mind that the NDWI compares two bands of the light spectrum (GREEN and NIR), the mathematical model of this metric developed in 1996 by researcher Norman D. McFeeters has a fairly simple logic.
Since water reflects more green light and strongly absorbs near-infrared light, by recognizing the green band and subtracting the NIR band, the index minimizes the reflectance of surfaces. In other words, it is able to highlight watercourses in remotely sensed images.
Thus, when a satellite detects this information, it is possible to generate a map clearly illustrating where the water bodies are, what their volumes are and how changes in their structures have occurred over time - while also being able to consult historical records and compare them.
Interpretation of NDWI values
With a level of accuracy that would be impossible to achieve with field measurements alone, this spectral index has a range of values between -1 and 1:
- ≥ 0 (positive values, generally between 0.2 and +1): occur when water reflects green light more than NIR, indicating areas with the presence of water or high humidity;
- ≤ 0 (negative values, close to 0 to -1): indicate exposed ground cover, drought, vegetation with low humidity, buildings or urban areas.
Proposed by McFeeters, these parameters reveal both subtle variations in moisture content and large-scale transformations - essential assessments for environmental managers.
Main advantages and practical applications
Less affected by atmospheric interference than other indicators, the NDWI allows for refined monitoring in almost real time. This is why it is widely adopted by farmers, companies and governments in water resource management (WRM), in planning policies for sustainability and the use of water and soil, and even in the prevention of natural disasters.
Of great value to precision agriculture and forestry, this powerful spectral index has the following main applications:
- Detection and recognition of bodies of water: automatically identify, map and delineate the contours of water bodies;
- Water analysis and monitoring: monitor the amount of water in the soil and vegetation and monitor the water content of the leaves;
- Monitoring droughts and floods: diagnose problems in plantations such as areas of exposed soil, drought or flooding in order to anticipate risks and plan preventive actions;
- Optimizing irrigation and drainage: pinpoint areas with moisture deficiency or saturation, for localized irrigation or drainage interventions according to the soil's real needs, avoiding waste and optimizing resources;
- Firefighting: monitor the humidity of the vegetation to warn of fire risks and indicate areas with potential for flammability and fire spread;
- Control of water pollution and turbidity: monitor changes in the color of the water, which indicate changes in its quality and possible contamination;
- Watershed management: observe water reserves for continuous data on their volume and distribution;
- Ecosystem health: assessing the water balance of natural and productive areas.
Thinking of using the NDWI and other environmental parameters to leverage your water management, forestry and agricultural productivity projects?
Get in touch with Forest Watch and discover how our powerful suite of spatial intelligence solutions applied to the field can transform data into accurate and reliable information for better results.
*NDVI - Normalized Difference Vegetation Index. Normalized Difference Vegetation Index
*SMI - Soil Moisture Index Soil Moisture Index
Leave a Reply